Empowering Businesses with Data-Driven Insights

Unlock your potential with our tailored BI services today.

Transform data into actionable business insights effortlessly.

Seamlessly integrate your data for better decision-making.

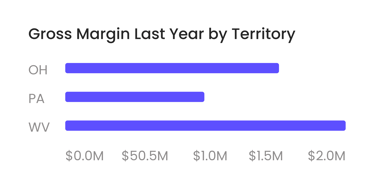
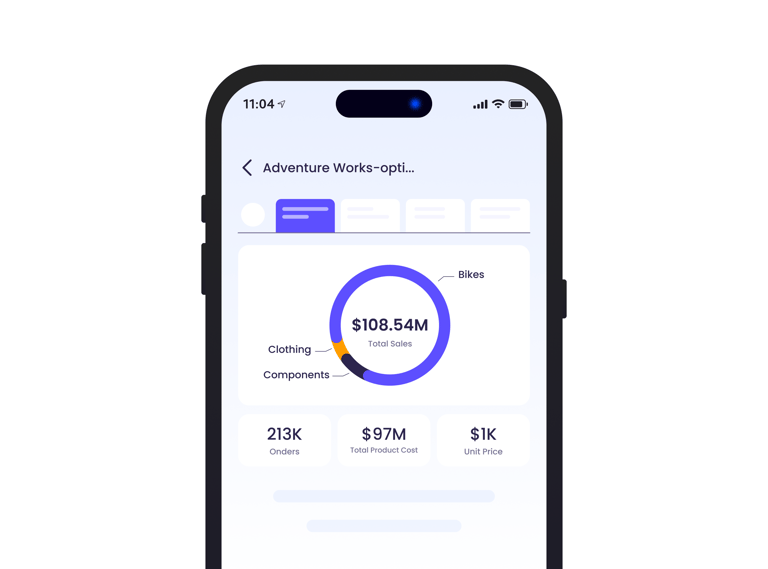
Visualize key performance indicators in real-time dashboards.

A digital dashboard displays metrics related to web performance. Graphs show detailed statistics such as total clicks, total impressions, average click-through rate (CTR), and average position over time. The chart utilizes various colors to distinguish different data sets, and the interface features tabs labeled 'QUERIES', 'PAGES', 'COUNTRIES', 'DEVICES', and 'SEARCH APPEARANCE'.
A digital dashboard displaying various analytics charts and graphs. There is a line graph showing user engagement over time on the left, a section with total revenue marked as $74K, and bar charts illustrating user statistics by region. The central section highlights users in the last 30 minutes, focusing on different countries such as the United States, Canada, India, Pakistan, and Brazil.
A computer screen displaying analytics dashboards with various charts, including a line graph on the left and a cohort analysis table on the right. The table is populated with different shades of blue, indicating varying levels of user activity over several weeks. Text labels and numbers detail user retention statistics.

Empowering Businesses Through Data Solutions

At Your Data Solutions, we specialize in providing tailored BI services that help businesses of all sizes leverage their data for actionable insights and informed decision-making.

A computer screen displaying a data analytics dashboard with graphs and charts. A blue line graph shows fluctuations in data over time, and a section highlights the number of page views. A pie chart is partially visible, indicating a breakdown of different data elements.

150+

15

Trusted by Clients

Data Driven

Data Integration Services

We provide BI services to connect, load, and visualize your data for informed decision-making.
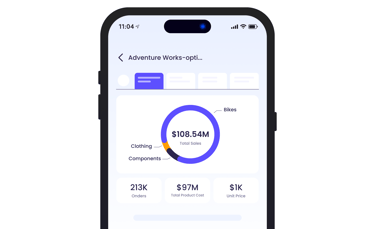
KPI Dashboard Setup
A computer screen displaying an analytics dashboard with metrics such as event activity, showing a current value of 4.7k for today's activity. There are graphs indicating trends and peaks in the data, as well as labels for different types of events.

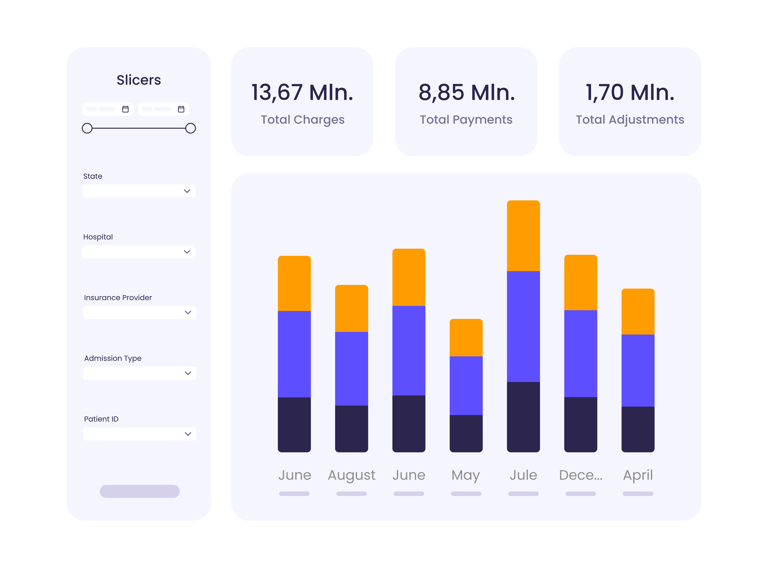
Create customized dashboards to visualize key performance indicators tailored to your business needs.

A laptop with an open screen displaying dashboard analytics featuring charts, graphs, and numerical data related to sales and subscriptions. The interface is predominantly dark-themed with sections highlighting key performance metrics. The device shown is a MacBook Pro, indicated by the keyboard layout and branding.
A digital screen displaying analytical data with line graphs, histograms, and numerical values. The data is presented in a user-friendly interface with different shades of blue used to distinguish various elements.
Cloud Database Solutions

Seamlessly load your data into the cloud for easy access and analysis anytime, anywhere.

Transform your data into actionable insights with our expert BI services and solutions.

Business Intelligence Services

Client Feedback

Hear what our clients say about our BI services and solutions.

Your Data Solutions transformed our data into actionable KPIs, enhancing our business decisions significantly.

John Smith
An iPad displaying data visualization content next to a book titled 'Data Science for Business.' The iPad is showing notes and a diagram about dashboard design, accompanied by a stylus placed between the iPad and the book.

New York

The integration process was seamless, and the dashboards provided invaluable insights into our performance metrics. Highly recommend their services for any business looking to leverage data effectively.

A person is holding a smartphone displaying an analytics or insights screen with various metrics and numbers. The individual is wearing a casual white shirt and a watch with a black band. The surrounding environment includes an indoor plant.
Emily Davis

Los Angeles

★★★★★
★★★★★

Get in Touch with Us

Reach out for BI services and KPI dashboard integrations today!

A laptop on a wooden desk displays a web application interface featuring graphs and statistics. Beside it, a large monitor shows a webpage promoting an all-in-one meeting app. A cup with a recognizable green and white logo sits on the desk.